In this article we will see how we can export metrics from a Spark Java application so that Prometheus can scrape them for application monitoring purposes.
Check out the full source code here
What is Prometheus anyway?
Before we get to that, we have to appreciate a few things:
- Developers usually want to improve performance of their applications (i.e. to optimize their applications)
- “Premature optimization is the root of all evil”
- Knowing how the system behaves can guide on which areas to focus on for optimizations
- Two things that can help us understand the behavior of a system in production are:
- Logs and
- Metrics (our focus for this article)
- Metrics provide numerical, quantifiable measures of performance
- Metrics are only useful if you can store, retrieve them from somewhere and ofcourse review/analyze them.
- Prometheus enables developers and sysadmins to collect metrics from their applications.
Prometheus is an open-source systems monitoring and alerting toolkit originally built at SoundCloud. Since its inception in 2012, many companies and organizations have adopted Prometheus, and the project has a very active developer and user community (https://prometheus.io/docs/introduction/overview/)
Prometheus collects metrics from monitored targets by scraping metrics HTTP endpoints on these targets. Since Prometheus also exposes data in the same manner about itself, it can also scrape and monitor its own health.
Prometheus also supports the push-based model for collecting metrics via it’s Push Gateway, but that’s for another day.
Micrometer
In order to record and collect metrics in our application, we will make use of the Micrometer library.
Micrometer provides a simple facade over the instrumentation clients for the most popular monitoring systems, allowing you to instrument your JVM-based application code without vendor lock-in. Think SLF4J, but for metrics. (https://micrometer.io/)
Required dependencies
You will need the following dependencies, assuming you use Maven:
<properties>
    <spark.version>2.9.2</spark.version>
    <micrometer.version>1.5.5</micrometer.version>

    <project.build.sourceEncoding>UTF-8</project.build.sourceEncoding>
</properties>

<dependencies>
  <dependency>
      <groupId>com.sparkjava</groupId>
      <artifactId>spark-core</artifactId>
      <version>${spark.version}</version>
  </dependency>
  <dependency>
    <groupId>io.micrometer</groupId>
    <artifactId>micrometer-core</artifactId>
    <version>${micrometer.version}</version>
  </dependency>
  <dependency>
    <groupId>io.micrometer</groupId>
    <artifactId>micrometer-registry-prometheus</artifactId>
    <version>${micrometer.version}</version>
  </dependency>
</dependencies>
Metrics Server
Since we are using Spark Java, we can decide to have our main API and Metrics servers as two different http servers in the same JVM process. This allows us to sort of isolate the metrics endpoint from our core application.
It’s a pattern Dropwizard uses for separting the “app” and “admin” functionalities, I quite like it.
The Prometheus metrics can be exposed on an Http server using the following:
import io.micrometer.prometheus.PrometheusMeterRegistry;

/**
 * Server for exposing Prometheus metrics.
 * With additional functionality for turning the server on/off.
 */
public class PrometheusSparkServer {
    private final PrometheusMeterRegistry prometheusRegistry;
    private final spark.Service server;

    public PrometheusSparkServer(String host, int port, PrometheusMeterRegistry metricRegistry) {
        prometheusRegistry = metricRegistry;
        server = spark.Service.ignite();
        server.ipAddress(host);
        server.port(port);
    }

    public void start() {
        server.get("/metrics", (req, res) -> prometheusRegistry.scrape());
        server.awaitStop();
    }
}
Prometheus Configuration
The following configuration will enable us to scrape from the metrics endpoint on our server:
global:
  scrape_interval:     15s # Set the scrape interval to every 15 seconds. Default is every 1 minute.
  evaluation_interval: 15s # Evaluate rules every 15 seconds. The default is every 1 minute.
  # scrape_timeout is set to the global default (10s).

# Alertmanager configuration
alerting:
  alertmanagers:
  - static_configs:
    - targets:
      # - alertmanager:9093

# Load rules once and periodically evaluate them according to the global 'evaluation_interval'.
rule_files:
  # - "first_rules.yml"

# A scrape configuration containing exactly one endpoint to scrape:
scrape_configs:
  - job_name: 'prometheus'
    static_configs:
    - targets: ['localhost:9090']

  # Scrape configuration for our sparkjava application here
  - job_name: 'sparkjava-micrometer-prometheus'
    metrics_path: /metrics
    # scheme defaults to 'http'.
    static_configs:
    - targets: ['localhost:4550']
Example application
The following application below is a simple service that allows users to upload a Excel files (using Zerocell to extract the rows) and store the data in a HashMap
public class Main {
    private static final Map<String, List<Person>> db = new ConcurrentHashMap<>();

    public static void main(String... args) {
        final PrometheusMeterRegistry registry=  new PrometheusMeterRegistry(PrometheusConfig.DEFAULT);

        final Gson gson = new Gson();
        final int port = 4567;
        Spark.port(port);

        Spark.post("/upload/people", (request, response) -> {
            request.attribute("org.eclipse.jetty.multipartConfig", new MultipartConfigElement("/temp"));
            Part filePart = request.raw().getPart("file"); //file is name of the upload form
            if (filePart == null)
                return Spark.halt(400);
            if (filePart.getInputStream() == null)
                return Spark.halt(400);
            registry.counter("file.uploads", "endpoint", "/upload/people").increment();
            Path tmpPath = Files.createTempFile("z","xlsx");
            Files.copy(filePart.getInputStream(), tmpPath, StandardCopyOption.REPLACE_EXISTING);

            List<Person> people = Reader.of(Person.class)
                .from(tmpPath.toFile())
                .list();

            registry.counter("people.total").increment(people.size());

            registry.counter("people.fetch", "endpoint", "/upload/people").increment();

            db.put(filePart.getSubmittedFileName(), people);
            response.type("application/json;charset=utf-8");
            return gson.toJson(people);
        });

        Spark.get("/people/all", (request, response) -> {
            registry.counter("people.fetch", "endpoint", "/people/all").increment();
            List<Person> allPeople = db.values()
                .stream()
                .flatMap(Collection::stream)
                .collect(Collectors.toList());

            response.type("application/json;charset=utf-8");
            return gson.toJson(allPeople);
        });

        new PrometheusSparkServer("localhost", 4550, registry).start();
    }
}
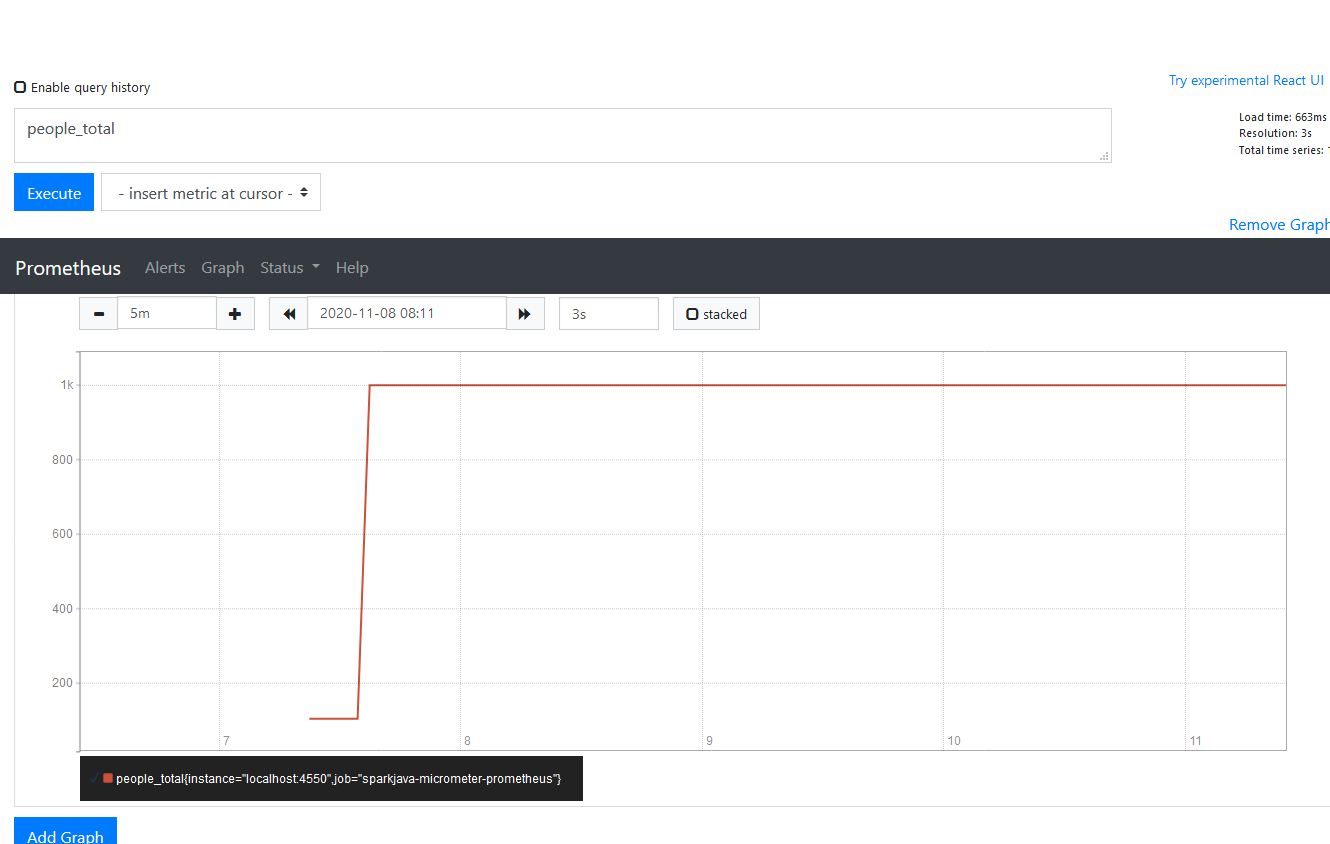
Here’s a screenshot from Prometheus’ dashboard after uploading some files to the /upload/people endpoint

Check out the full source code here
Reach out on Twitter @zikani03 if you have any comments, suggestions or corrections.